Small Cap Growth – Q3 2025 Commentary
Categorised in: Commentaries, Q3 2025, Small Cap Growth Commentaries
|
Small-capitalization stock performance was robust in the third quarter, both absolutely and relatively, with the Russell 2000® Index +12.39% and the Russell Microcap® Index +17.03% vs. the Russell 1000® +7.99%. However, it was a very difficult period for active managers to keep up and deeper analysis highlights the primary reasons why: the outperformance delta between individual stocks was larger than average and led by a historically narrow group of stocks with typical “low quality” factors. Excluding biotechnology names, only 30% of R2 index stocks outperformed (third lowest in any quarter since 1986)¹. And applying our own factor analysis to the Russell 2000® index showed that not only were these top performers typically unprofitable (low EBITDA/EV), with a high valuation (price to sales), high volatility (beta), high momentum, and high short interest, but they were in the highest quintile on every one of these metrics (i.e. the most extreme).
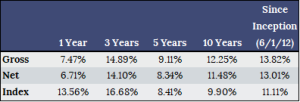
Source: Factset Resource Inc. While reflecting on this environment, it is worth noting that our portfolio was performing relatively well thru the typical earnings reporting season (i.e. end of August), which provides some comfort that, in aggregate, our companies continue to execute similarly in, an albeit, choppy environment. It was really only in the month of September when this previously described performance gap occurred. Announcements from several major artificial intelligence (AI) firms regarding their investment plans & new technology endorsements led to outsized returns in specific companies and/or industry areas with exposure to those multi-year potential opportunity. In contrast, for the majority of companies dependent on generating revenues in today’s economy, macro concerns continued to build in the face of monthly data indicating a stagnant consumer and cautious enterprise spending. This created meaningful bifurcation in monthly price performance and the narrowness of the market. While it is normal for low quality factors to outperform in the beginning of an interest rate cycle, this does not appear to be a typical “early cyclical” rotation. This is different. While we have been bullish on the outlook for AI and industrial onshoring investment spend, we have been surprised by how much value the market has been willing to ascribe to certain more nascent solutions where the future market size and market shares are far from certain. While recognizing that artificial intelligence, and its power demands, will provide for a number of multi-year growth opportunities, we will continue to take a balanced approach to investing that includes evaluating the status of proven unit economics, execution time frames, and valuations. Performance: The KCM Small Cap Growth (SCG) composite increased +5.64% (gross of fees) and +5.44% (net of fees) for the third quarter of 2025, underperforming the Russell 2000® Growth (R2G) Index, which increased by +12.19%, by -655 bps (gross of fees) and -675 bps (net of fees). Year-to-date the KCM SCG composite increased +5.83% (gross of fees) and +5.27% (net of fees), underperforming the R2G Index, which increased +11.65%, by -582 bps (gross of fees) and -639 bps (net of fees). Additional performance information included in the table below.
Data as of 9/30/2025 On a relative basis Health Care and Real Estate were the best-performing sectors versus the benchmark in the quarter. Health Care was led by strong gains in a biotechnology company following very positive results in two pivotal Phase 3 trials for one of their drug, which is expected to launch in 2026. The outperformance from Real Estate was simply the result of not owning any companies in this underperforming sector. The largest detractors to relative performance for the quarter were Industrials and Consumer Discretionary. At an individual stock level, Industrials was most impacted by our not owning one stock, which increased +254% during the period following the announcement that, a large data center developer, would deploy their fuel cell technology as an onsite power solution. Additionally, underperformance in the sector from owned names was led by an operator of a digital marketplace for used wholesale vehicles, which declined following a weak Q2 and reduced earnings outlook. This was primarily due to macro headwinds continuing to impact their end market more than anticipated, with weak auto market volumes and lower conversion rates constraining the revenue potential at the same time they are continuing to invest in a new commercial platform. The sizeable stock price reaction seems to reflect greater concerns around their ability to continue gaining market share, however, there has been a lot of quarterly volatility in these metrics and the recent tariff “noise” has likely impacted dealer behavior. We will be watching market share gains closely in the coming quarter to confirm that our long-term thesis remains intact. Consumer Discretionary underperformance was led by a decline in a franchisor and operator of restaurants. While still growing units rapidly, The company has experienced slightly weaker same store sales growth this year (along with the entire restaurant industry) as consumer budgets appear to be facing constraints. While this is a drag on near term earnings, we do not expect it to have a significant impact on the longer-term potential as the company increases its global footprint and benefits from several specific initiatives that should increase unit throughput over the next couple of years (i.e. smart kitchen and loyalty program). For the year-to-date period, relative performance was strongest in the top outperforming sectors of Communications Services and Consumer Discretionary. Unfortunately, the largest detractors to performance, Industrials and Information Technology, were more significant and more than offset. Outlook: We anticipate a mixed Q3 earnings reporting season as overall activity has remained relatively steady, but there is clear bifurcation between the areas that are benefitting from increased capital investment (AI, onshoring) vs. those that are not. And while we expect that the Federal Reserve will continue to reduce the Fed Funds Rate, it is not clear to what degree this will impact the longer end of the curve and act as an economic stimulant. These items may continue to result in market volatility and could impact our expectation for overall economic growth and/or a certain sector’s ability to fully participate. However, outside of these factors there are a couple of large transformational multi-year growth opportunities that we expect will persist, such as Artificial Intelligence, onshoring of production, and increasing power generation needs, which are driving significant domestic investment and business activity. Several sectors are also benefitting from shifting government spending policies and/or an expectation of lower government regulations. And even though there are macro pressures in certain sectors of the economy, there are individual companies that can offset this by gaining meaningful market share. The core of our strategy remains focused on identifying companies that can benefit from these types of durable trends, or simply their own unique product opportunities, to gain market share and/or expand their end markets meaningfully with good economic returns. Rather than trying to predict specific short term macro-outcomes, we use scenario analysis and continually adjust the portfolio to lean into the best risk/reward opportunities that the market provides. Thank you for your continued confidence in the Kennedy Capital team. Should you have any additional questions, please do not hesitate to contact us. Sincerely, |
|
| Jean Barnard, CFA®
Portfolio Manager |
Ryan Dunnegan, CPA & Alex Mosman, CFA®
Assistant Portfolio Managers |
| Download PDF | |
|
Important Disclosures ¹Karande , A. (2025). 3Q25 Quarter-End Letter [Review of 3Q25 Quarter-End Letter]. Furey Research Partners. Kennedy Capital Management LLC (“KCM”) is a Delaware limited liability company headquartered in Missouri. KCM is registered as an investment adviser with the Securities and Exchange Commission under the Investment Advisers Act of 1940. Registration with the SEC does not imply any level of skill or training. Clients of the Firm include U.S. corporations, pension and profit sharing funds, colleges and universities, trusts, not-for-profit organizations, foundations, and individuals. KCM claims compliance with the Global Investment Performance Standards (GIPS®). GIPS® is a registered trademark of CFA Institute. CFA Institute does not endorse or promote this organization, nor does it warrant the accuracy or quality of the content contained herein. GIPS® are a set of standardized, industry-wide ethical principles that provide investment firms with guidance on calculating and reporting their investment results to prospective clients to ensure fair representation and full disclosure of an investment firm’s performance history. Although the statements of fact and data in this report have been obtained from, and are based upon, sources that the Firm believes to be reliable, we do not guarantee their accuracy, and any such information may be incomplete or condensed. All opinions included in this report constitute the Firm’s judgment as of the date of this report and are subject to change without notice. This report is for informational purposes only and is not intended as an offer or solicitation with respect to the purchase or sale of any security. A complete list of all securities recommended by KCM in the preceding year, a fully compliant GIPS composite report, and the list of composite descriptions are available upon request from KCM at 10829 Olive Blvd., Suite 100. St. Louis, MO, 63141. Investing in the stock market involves gains and losses and may not be suitable for all investors. Investing in equity securities is speculative and involves substantial risk. Small cap securities may involve more risk than larger-cap securities. Investments concentrated in sector or specific industry may involve greater risk and volatility than more diversified investments. The Small Cap Growth Composite invests in growth securities of predominately small companies that generally have a market capitalization that is reflective of the Russell 2000® Growth Index. The Manager seeks companies with durable business models able to deploy assets into growing sets of opportunities providing superior rates of return. For comparison purposes the composite is measured against the Russell 2000® Growth Index. The U.S. Dollar is the currency used to express performance. Composite specific data provided within this presentation has been calculated from accounts that are discretionary as defined in this paragraph. The assets shown are derived only from discretionary accounts. Non-discretionary accounts, as defined by KCM, are accounts that are not included in the composite due to one or any combination of the following criteria: there were significant cash inflows or outflows within the account; the account’s asset level did not meet the minimum requirement to remain in the composite; the account assets are managed by others using our non-discretionary model. The temporary removal of such an account occurs at the beginning of the month and the account re-enters the composite the month after the criteria has been met. Performance returns are presented gross and net of investment advisory fees and include the reinvestment of all income. Gross of fee returns reflect the deduction of transaction costs and custodian fees but do not reflect the deduction of investment advisory fees. Net of fee performance is calculated using gross returns less the actual applicable annual management fee applied monthly. Past performance is not indicative of future results. A client’s return will be reduced by the advisory fees as described in Form ADV Part 2A and other expenses incurred by the account. For example, an annual advisory fee of 1% compounded quarterly over 10 years will reduce a gross 14.44% annual return to a net 13.32% annual return. Form ADV Part 2A is available upon request. The performance figures reported herein are unaudited, may be based upon information obtained via electronic data sources (”feeds”) and may be subject to change. Data feeds from many of KCM clients’ selected custodians are obtained through third party sources, and are used to compare custodial data to KCM’s client account records as frequently as daily. Monthly, KCM reviews clients’ account holdings along with cash and share quantities against the custodial statements. In some instances, variances may exist between final audited custodial information and the information KCM obtains via such data feeds. Generally, any such variances are researched and reconciled within thirty days of the period end. The information provided should not be considered a recommendation to purchase or sell any particular security. There is no assurance that any securities discussed herein will remain in a KCM portfolio at the time you receive this letter or that securities sold have not been repurchased. Allocations among industries, sectors and securities may vary and are subject to change without notice. Any securities discussed do not represent an account’s entire portfolio and, in the aggregate, may represent only a small percentage of an account’s portfolio holdings. It should not be assumed that any of the industry or sector allocation decisions mentioned, or securities transactions or holdings discussed were or will be profitable, or that the investment recommendations or decisions we make in the future will be profitable or will equal the investment performance of the securities discussed herein. Sector Weightings are subject to change at any time. Sectors are based on the Global Industry Classification Standard (“GICS”) classification scheme and are measured as a percentage of the total composite in terms of asset value as of the date indicated above. Individual client portfolios may be different based on variations in security purchase price and date, and individual client restrictions. GICS was developed by and is the exclusive property and a service mark of Morgan Stanley Capital International, Inc. (”MSCI”) and Standard & Poor’s, a division of The McGraw-Hill Companies, Inc. (”S&P”) and is licensed for the use by KCM. Neither MSCI, S&P, nor any other party involved in making or compiling the GICS or any GICS classifications makes any express or implied warranties or representations with respect to such standard or classification (or the results thereof),and all such parties hereby expressly disclaim all warranties of originality, accuracy, completeness, merchantability, and fitness for a particular purpose with respect to any of such standard or classification. Without limiting any of the foregoing, in no event shall MSCI, S&P, any of their affiliates or any third party involved in making or compiling the GICS or any GICS classifications have any liability for any direct, indirect, special, punitive, consequential or any other damages (including lost profits) even if notified of the possibility of such damages. Allocations to various assets classes change over time and deviate from any stated or targeted percentages of a total portfolio as a result of market conditions and reallocation decisions. Therefore, nothing herein reflects a static portfolio allocation that will remain the same or match stated target allocations of asset classes. Russell Investment Group is the source and owner of the Russell Index data contained or reflected in this material and all trademarks and copyrights related thereto. The presentation may contain confidential information and unauthorized use, disclosure, copying, dissemination or redistribution is strictly prohibited. This is a presentation of Kennedy Capital Management. Russell Investment Group is not responsible for the formatting or configuration of this material or for any inaccuracy in Kennedy Capital Management’s presentation thereof. The Russell 1000® Index measures the performance of the large-cap segment of the US equity universe. It is a subset of the Russell 3000® Index and includes approximately 1,000 of the largest securities based on a combination of their market cap and current index membership. The Russell 1000 represents approximately 93% of the US market. The Russell 1000® Index is constructed to provide a comprehensive and unbiased barometer for the large-cap segment and is completely reconstituted annually to ensure new and growing equities are included. The Russell 2000® Index measures the performance of the small-cap segment of the U.S. equity universe. The Russell 2000® Index is a subset of the Russell 3000® Index representing approximately 7% of the total market capitalization of that index, as of the most recent reconstitution. It includes approximately 2000 of the smallest securities based on a combination of their market cap and current index membership. The Russell 2000® is constructed to provide a comprehensive and unbiased small-cap barometer and is completely reconstituted annually to ensure larger stocks do not distort the performance and characteristics of the true small-cap opportunity set. The Russell 2000® Value Index measures the performance of small-cap value segment of the U.S. equity universe. It includes those Russell 2000® companies with relatively lower price-to-book ratios, lower I/B/E/S forecast medium term (2 year) growth and lower sales per share historical growth (5 year) . The Russell 2000® Value Index is constructed to provide a comprehensive and unbiased barometer for the small-cap value segment. The Index is completely reconstituted annually to ensure new and growing equites are included and that the represented companies continue to reflect value characteristics. The Russell 2000® Growth Index measures the performance of the small-cap growth segment of the U.S. equity universe. It includes those Russell 2000® companies with relatively higher price-to-book ratios, higher I/B/E/S forecast medium term (2 year) growth and higher sales per share historical growth (5 year). The Russell 2000® Growth Index is constructed to provide comprehensive and unbiased barometer for the small-cap growth segment. The Index is completely reconstituted annually to ensure new and growing equities are included and that the represented companies continue to reflect growth characteristics. The Russell 2000® Growth Index is used as the benchmark. The Index is unmanaged and represents total returns including reinvestment of dividends. The benchmark is used for comparative purposes only and generally reflects the comparable risk or investment style of the Firm’s strategy. The investment portfolios underlying the Index are different from the investments in the portfolios managed by the Firm. Certain accounts may also use other benchmarks not listed in the GIPS composite report. The Verification and Performance Examination Report does not cover the benchmark returns included in the GIPS composite report. Investors cannot invest directly in an Index. |
|