


Small/Mid Cap Core – Q2 2026 Commentary
Categorised in: Commentaries, Q2 2026, Small/Mid Cap Core Commentaries
The Russell 2500™ Index returned 20.3% in the second quarter of 2026, as robust performance in the Information Technology sector combined with optimism regarding a potential resolution to the conflict in the Middle East. The outlook for interest rates is moving in an increasingly hawkish direction, as employment levels have been resilient and inflation continues to trend above target levels. While Information Technology stocks represented 18.5% of the Russell 2500™ in the quarter, this sector drove nearly 50% of the absolute return in the index.
During the second quarter, the portfolio’s largest overweight exposure was in the Industrials sector, while Financials and Energy represented the most significant underweights. We continue to find attractively priced Industrial businesses with a diverse set of end markets that fit well in our stock selection and portfolio construction approach.
Performance & Characteristics
In Q2 2026, the Small/Midcap Core portfolio returned 20.6% net of fees, outperforming the Russell 2500™ benchmark by 36 bps. The portfolio modestly outperformed this quarter, but the benchmark’s returns had an unusual composition worth noting. Three of the six worst-performing stocks on a relative basis in Q2 were unowned index constituents—a rare occurrence—combining for a 358 bps drag on relative performance. One stock alone cost 274 bps in the quarter, 372 bps YTD, and 453 bps over the trailing year.
An information technology stock returned 4,510% over the twelve months ended 6/30/26. The company makes memory chips used in PCs, servers, and increasingly in AI datacenters. Memory has historically been a commodity business prone to boom-bust cycles, but AI-driven demand created an unusual supply/demand imbalance, giving this company and its peers unprecedented pricing power: gross margins jumped from the low 20%’s a year ago to nearly 80% by March 2026, a level we view as unsustainable. The company entered 2026 at a $35B market cap (already above our typical buy range) and reached $310B by 6/26/26, its last day in the Russell 2500TM before annual reconstitution removed it. While we underestimated the memory industry’s pricing power, we’ve generally avoided commodity tech in favor of businesses with a more durable competitive advantage.
In our view, this dynamic may be less likely to recur in the quarters and years ahead. Russell is shifting to semi-annual reconstitution starting in December 2026, which will more promptly remove companies that outgrow the benchmark.
Further details on long-term performance can be found in the table below:
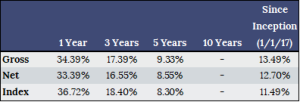
Data as of 6/30/2026
The outperformance in the quarter was driven by strong stock selection in the Industrials sector, which added 292 bps of relative performance, and the portfolio’s underweight position in the Energy sector, which added 90 bps. Partial offsets included the aforementioned unfavorable information technology stock impact (274 bps), stock selection in Health Care (123 bps) and an unfavorable 60 bps impact from the 2.9% weighting in cash in the portfolio given the robust absolute returns this quarter.
We remain confident in our ability to construct a portfolio with attractive fundamental characteristics that delivers relative investment outperformance over the long term. As always, we appreciate the confidence you place in our team. Please don’t hesitate to contact us with any questions regarding Kennedy Capital Management or our investment process.
Sincerely,
| Chris McDonald, CFA®
Portfolio Manager |
Sam Peterman, CFA®
Assistant Portfolio Manager |
||
|
|||
|
Important Disclosures Kennedy Capital Management LLC (“KCM”) is a Delaware limited liability company headquartered in Missouri. KCM is registered as an investment adviser with the Securities and Exchange Commission under the Investment Advisers Act of 1940. Registration with the SEC does not imply any level of skill or training. Clients of the Firm include U.S. corporations, pension and profit sharing funds, colleges and universities, trusts, not-for-profit organizations, foundations, and individuals. KCM claims compliance with the Global Investment Performance Standards (GIPS®). GIPS® is a registered trademark of CFA Institute. CFA Institute does not endorse or promote this organization, nor does it warrant the accuracy or quality of the content contained herein. GIPS® are a set of standardized, industry-wide ethical principles that provide investment firms with guidance on calculating and reporting their investment results to prospective clients to ensure fair representation and full disclosure of an investment firm’s performance history. Although the statements of fact and data in this report have been obtained from, and are based upon, sources that the Firm believes to be reliable, we do not guarantee their accuracy, and any such information may be incomplete or condensed. All opinions included in this report constitute the Firm’s judgment as of the date of this report and are subject to change without notice. This report is for informational purposes only and is not intended as an offer or solicitation with respect to the purchase or sale of any security. A complete list of all securities recommended by KCM in the preceding year, a fully compliant GIPS composite report, and the list of composite descriptions are available upon request from KCM at 10829 Olive Blvd., Suite 100. St. Louis, MO, 63141. Investing in the stock market involves gains and losses and may not be suitable for all investors. Investing in equity securities is speculative and involves substantial risk. Small cap and mid cap securities may involve more risk than larger-cap securities. Investments concentrated in sector or specific industry may involve greater risk and volatility than more diversified investments. Small/Mid Cap Core Composite is invested in securities of value and growth companies that have a market capitalization ranging from small cap to midcap, generally reflective of the Russell 2500™ Index. We generally look for value companies that trade at an attractive relative valuation on a price-to-earnings and price-to-cash flow basis, and growth companies that have opportunities to grow assets at returns above the cost of capital. The U.S. Dollar is the currency used to express performance. Composite specific data provided within this presentation has been calculated from accounts that are discretionary as defined in this paragraph. The assets shown are derived only from discretionary accounts. Non-discretionary accounts, as defined by KCM, are accounts that are not included in the composite due to one or any combination of the following criteria: there were significant cash inflows or outflows within the account; the account’s asset level did not meet the minimum requirement to remain in the composite; the account assets are managed by others using our non-discretionary model. The temporary removal of such an account occurs at the beginning of the month and the account re-enters the composite the month after the criteria has been met. Performance returns are presented gross and net of investment advisory fees and include the reinvestment of all income. Gross of fee returns reflect the deduction of transaction costs and custodian fees but do not reflect the deduction of investment advisory fees. Net of fee performance is calculated using gross returns less the actual applicable annual management fee applied monthly. Past performance is not indicative of future results. A client’s return will be reduced by the advisory fees as described in Form ADV Part 2A and other expenses incurred by the account. For example, an annual advisory fee of 1% compounded quarterly over 10 years will reduce a gross 14.44% annual return to a net 13.32% annual return. Form ADV Part 2A is available upon request. The performance figures reported herein are unaudited, may be based upon information obtained via electronic data sources (”feeds”) and may be subject to change. Data feeds from many of KCM clients’ selected custodians are obtained through third party sources, and are used to compare custodial data to KCM’s client account records as frequently as daily. Monthly, KCM reviews clients’ account holdings along with cash and share quantities against the custodial statements. In some instances, variances may exist between final audited custodial information and the information KCM obtains via such data feeds. Generally, any such variances are researched and reconciled within thirty days of the period end. The information provided should not be considered a recommendation to purchase or sell any particular security. There is no assurance that any securities discussed herein will remain in a KCM portfolio at the time you receive this letter or that securities sold have not been repurchased. Allocations among industries, sectors and securities may vary and are subject to change without notice. Any securities discussed do not represent an account’s entire portfolio and, in the aggregate, may represent only a small percentage of an account’s portfolio holdings. It should not be assumed that any of the industry or sector allocation decisions mentioned, or securities transactions or holdings discussed were or will be profitable, or that the investment recommendations or decisions we make in the future will be profitable or will equal the investment performance of the securities discussed herein. Sector Weightings are subject to change at any time. Sectors are based on the Global Industry Classification Standard (“GICS”) classification scheme and are measured as a percentage of the total composite in terms of asset value as of the date indicated above. Individual client portfolios may be different based on variations in security purchase price and date, and individual client restrictions. GICS was developed by and is the exclusive property and a service mark of Morgan Stanley Capital International, Inc. (”MSCI”) and Standard & Poor’s, a division of The McGraw-Hill Companies, Inc. (”S&P”) and is licensed for the use by KCM. Neither MSCI, S&P, nor any other party involved in making or compiling the GICS or any GICS classifications makes any express or implied warranties or representations with respect to such standard or classification (or the results thereof),and all such parties hereby expressly disclaim all warranties of originality, accuracy, completeness, merchantability, and fitness for a particular purpose with respect to any of such standard or classification. Without limiting any of the foregoing, in no event shall MSCI, S&P, any of their affiliates or any third party involved in making or compiling the GICS or any GICS classifications have any liability for any direct, indirect, special, punitive, consequential or any other damages (including lost profits) even if notified of the possibility of such damages. Allocations to various asset classes change over time and deviate from any stated or targeted percentages of a total portfolio as a result of market conditions and reallocation decisions. Therefore, nothing herein reflects a static portfolio allocation that will remain the same or match stated target allocations of asset classes. Russell Investment Group is the source and owner of the Russell Index data contained or reflected in this material and all trademarks and copyrights related thereto. The presentation may contain confidential information and unauthorized use, disclosure, copying, dissemination or redistribution is strictly prohibited. This is a presentation of Kennedy Capital Management. Russell Investment Group is not responsible for the formatting or configuration of this material or for any inaccuracy in Kennedy Capital Management’s presentation thereof. The Russell 2500™ Index measures the performance of the small to mid-cap segment of the U.S. equity universe, commonly referred to as “smid” cap. The Russell 2500™ Index is a subset of the Russell 3000® Index. It includes approximately 2500 of the smallest securities based on a combination of their market cap and current index membership. The Russell 2500™ Index is constructed to provide a comprehensive and unbiased barometer for the small to mid-cap segment. The Index is completely reconstituted annually to ensure larger stocks do not distort the performance and characteristics of the true small to mid-cap opportunity set. The Russell 2500™ Index are used as the benchmark. The Indexes are unmanaged and represents total returns including reinvestment of dividends. The benchmarks are used for comparative purposes only and generally reflects the comparable risk or investment style of the Firm’s strategy. The investment portfolios underlying the Indexes are different from the investments in the portfolios managed by the Firm. Certain accounts may also use other benchmarks not listed in the GIPS composite report. The Verification and Performance Examination Report does not cover the benchmark returns included in the GIPS composite report. Investors cannot invest directly in an Index. |
|||